Performance .NOT, a look at .NET Memory Performance Counters
I decided to review the .NET memory garbage collection problem I wrote about back in tip #11 as many articles have appeared recently on MSDN on memory management and how to tune it. Here is one typical article written in November 2006: CLR Inside Out: Investigating Memory Issues. I will have a look at the performance monitor counters related to .NET memory.
You can download the source and .NET 2.0 version of the C# program I used to test memory here:
dNET_CS_Cache_Test.zip 20 KB ZIP file, the managed C# version for .NET 2.0 only.
Warning: run this program on a dual or quad core computer or it may cause your GUI to lock up when large amounts of memory are allocated.
Note that this program allocates memory in 16 MB blocks and thus allocates them on the .NET large object heap. Blocks larger than about 80K will use this large object heap but don't take that figure as an absolute, other people have noticed different limits (they may change on different OS and .NET versions). The .NET garbage collector appears to treat the large object heap different than the small heap. You can expect network and database applications to make many allocations on the large object heap so they may behave different than simple applications that don't use large memory blocks.
Part of the problem with trying to optimize closed proprietary code is due to the fact that you can't inspect it and MS has not provided much information on how it is tuned or how to adjust it. With Linux and other OSS projects the kernel source is fully exposed and you can actually look at it to see how it works (but you might need the Linux Kernel Development or Understanding the Linux Kernel books to fully understand it). Sorry, this is not possible with .NET or Vista. With open source code you can actually get better performance than with closed code because others will suggest or even provide improvements. Examples are the task scheduler, TCP stack and virtual memory manager where Linux performance is normally better than Windows. If you don't believe this, see this blog about Vista TCP performance.
Results of .NET Cache Test
These tests were run in a VMware virtual machine running on an Intel Quad Core at 2.67 with 2 GB total memory. The virtual machine was running a base install of Windows Vista Business in 1 GB with two processors enabled. Vista performance in a virtual machine is very similar to a real machine except as noted. The comments are at the top of each image.
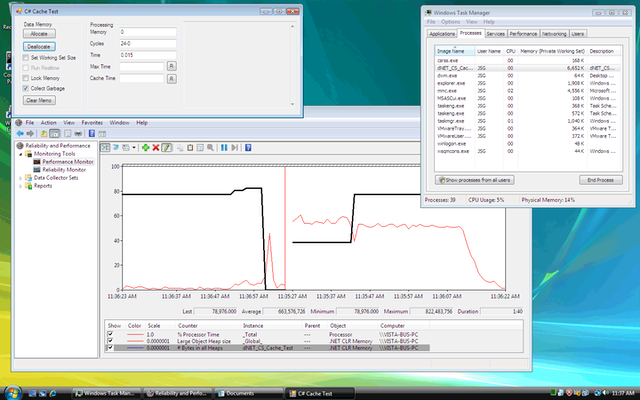
In this first screen shot, I have allocated about 150MB of memory. The task manager is showing the correct allocation, but the performance counter stopped at around 80 MB. Looks like the performance counters don't get updated often. Kind of hard to use the performance counters if they don't work!

Here I have allocated more than 800 MB and you can see how the performance counter increments in jumps.

Now I reduce the memory allocation back to zero yet both the .NET performance counters and the task manager indicate the memory is still being used. This was the problem covered in Tip #11.

After a single allocation, deallocation and call to GC.Collect everything is back to zero.
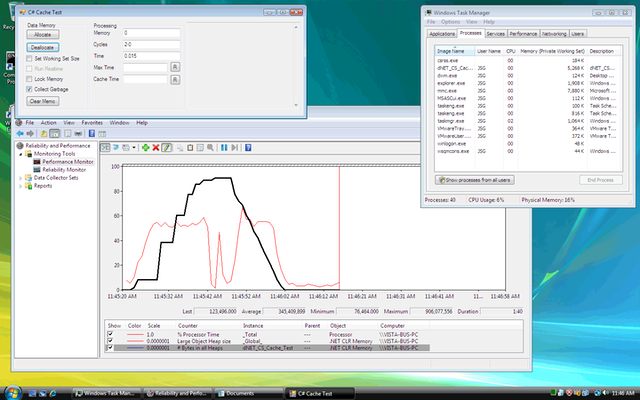
Here I run the memory up and down to show jumps. It seems the memory system updates performance counters during increases in memory better than when it is released. From this plot, we notice that Vista can sometimes release memory back to the system, while other times it won't. However, the final memory count still didn't end up at zero.

With GC.Collect enabled, the down slope is smooth.
Here I was trying to run out of memory. It appears you can't do it on Vista because the application locks up while moving memory around in the swap file and this makes it hard to get it to respond to more requests to increase memory. I had to use the task manager to kill the process because the program would no longer respond to mouse clicks.
Note: a real non-virtual machine may have offered slightly better swap file performance and may have responded to mouse clicks during out-of-memory conditions.

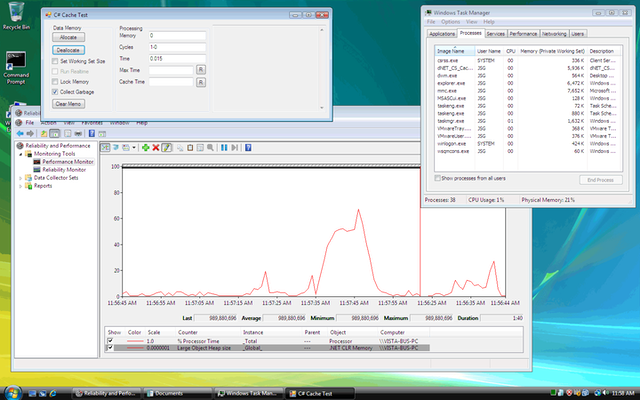
Now here is something odd, the large heap reading is stuck after I terminate the process. I had to delete it and add it again to get it back to normal.
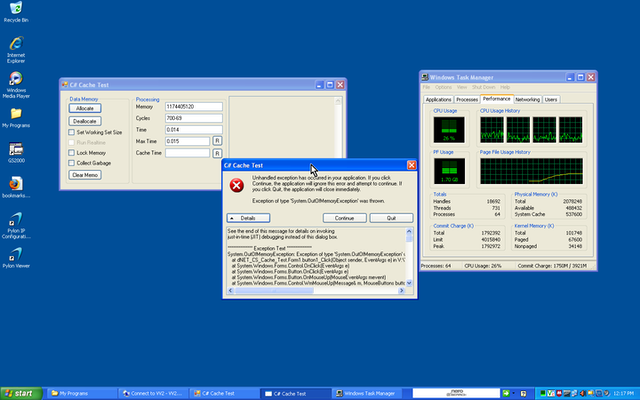
On the non-virtual Windows XP host it is easy to run out of memory well before the true physical memory is gone. This system had MS VS2005 installed, so your experience on another XP system may not be the same. It seems that Vista has less trouble with out-of-memory condtions than XP. Again, the tuning between .NET 2.0 and .NET 3.0 appears to be different.
Conclusions
- The .NET memory performance counters don't update correctly. It is quite hard to draw any conclusions about your program operation when the measurements can't be trusted.
- Memory is not released properly unless GS.Collect is called, even on the new Vista OS.
- Vista memory management appears to be better than on XP for out of memory condtions. It is possible to run out of memory on XP even though there is plenty of free memory.
- The 16 MB blocks allocated by my cache test program are allocated on the "large object heap" and it appears that this heap is not cleaned in the same way as the small object heap. Many database or image processing applications will use the large object heap and may suffer performance problems like this test case.
- .NET memory management is tuned differently on workstations, server systems and also on 64 bit systems. It also appears to operate different on Vista and XP. It is also possible that some MS applications (such as VS2005 or SQL server) may tune the memory manager for better performance when they are installed. As these tuning controls are not exposed to the ordinary programmer, they can't be used to solve any problems that may result.
- The only solution the ordinary programmer has to solve problems is to periodically call GC.Collect, and it appears this is quite commonly done even though all the .NET documentation warns you not to do so.